Recently, I had the opportunity to work with Paul Michele of Navionics — the people who make highly detailed charts for some of the biggest names in marine electronics, like Lowrance, Humminbird and Raymarine.
To say the least, this was an eye-opening experience.
The project involved gathering depth-recording data for a small lake in central Florida called Lake X. Perhaps you read my recent column titled “What Is Tackle-X?” where I describe this lake and an upcoming industry gathering prior to the ICAST show. Well, in preparation for that event, Paul wanted to develop a map for Lake X showing its underwater features so that participating electronics companies could demonstrate their newest products with accuracy.
Getting Started
I met Paul for breakfast in nearby St. Cloud, where he described the methods they use for gathering data. He said there were several ways to accumulate the information, and by his description they all seemed quite basic.
The first technique is to break a body of water down using a grid pattern, recording its depths while moving from shoreline to shoreline following the pattern. He said the tighter the grid, the more accurate the reading.
The next technique involves zigzagging from shallow to deep repeatedly as you follow the lake’s shoreline contour. This is most useful when near-shore bottom has unusual or irregular features.
The last he referred to as an “S” pattern, claiming this method best suits lakes that have slow tapering drops with few irregular features. It’s a more broad-stroke, generalized method for gathering data.
We used all three methods in our effort. Where we found highly irregular bottom features, we detailed those areas back and forth in both grid and zigzag fashion. Where the bottom sloped more gradually or showed little variation, we combined zigzagging with S-curved maneuvers to gather the data.
Because Lake X is approximately 1,500 surface acres, the effort took about eight hours … with a little fishing thrown in, of course. Paul’s a great angler and he enjoyed considerable action. Lake X is full of bass.
Technical Issues
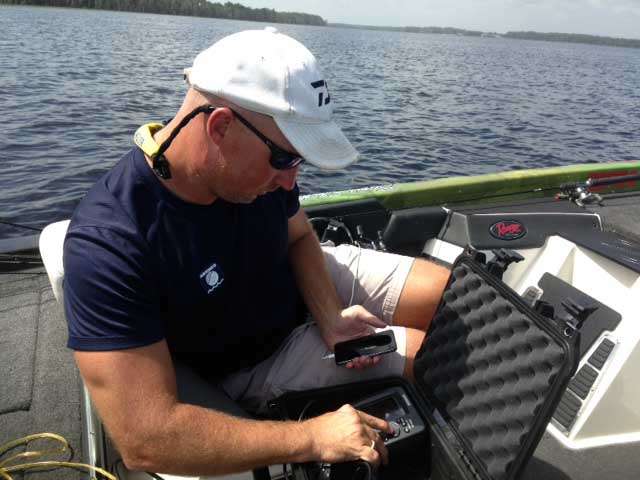
To record the lake’s underwater features, we relied on my Raymarine e97 with its latest CHIRP-DownVision technology. As a back-up, Paul brought along a portable Humminbird 386, for which we mounted a temporary transducer to one of the Power-Pole brackets off the stern. He inserted memory cards in both units to save the data.
As we dissected Lake X from a multitude of angles and patterns, these machines recorded the data in sync with a constant GPS signal. We worked from shallow to deep in some areas. In others, we traveled from shoreline to shoreline.
Seeing what lies beneath an unfamiliar lake is fascinating and believe me, Lake X had plenty to offer. It served as a test facility for Mercury Marine for 30 years, and the area closest to their docking facility was dredged to provide access. The resulting underwater trenches remain quite defined, even after so many years.
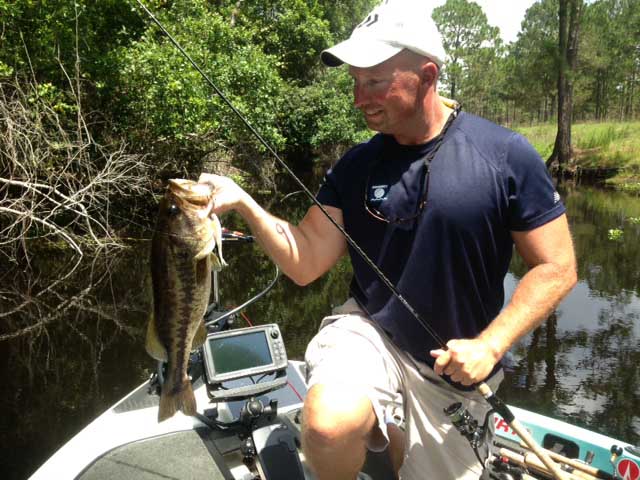
We saw schools of baitfish suspended at various depths relating to those ditches, and below them were the classic images of predator fish. It was like a downscaled version of what you would see on a major reservoir — irregular bottom attracting schools of baitfish and with them bass.
While providing all this detailed imagery, the e97 unit also recorded depth signals directly to the memory card, which Paul would later upload to Navionics’ website. At that point, they will decipher the data and mesh it with satellite images of the lake. Sort of like layering, the freshly recorded bottom contours are superimposed with aerial images, which include shoreline features, such as docks, seawalls and canals.
DIY Mapping
The technology we used to chart Lake X is available to anyone. By utilizing Navionics’ SonarCharts program, you too can map your own body of water. All you need is their Navionics+, Platinum+ or HotMaps Platinum card, a compatible GPS capable of logging data to the card, and a computer to up and download that information. Even cooler, there’s almost no limit to the amount of mapping you can do once you sign up. It’s just a matter of gathering the data, then uploading it to their website. They’ll do the rest.
Another benefit of the SonarCharts program is shared data. As other users submit their logs, that information is added to existing data. So as time passes, the charts become more and more refined. It’s an awesome concept, and one that benefits all involved.
So if you need a chart for your favorite body of water, simply build your own using this approach. Even if it has already been charted, you can enhance existing mapping by integrating your own gathered data using the Navionics bathymetry process.
For more on building lake maps, visit their site.
Follow Bernie Schultz on Facebook or through his website.


