
WASHINGTON — You may know that the government spends $6.5 billion per year, on average, for water conservation. Or that the Fish and Wildlife Service’s water conservation and sportfish restoration funds received $22 million less in 2014 than in the prior year. Or that the U.S. Army Corps of Engineers was allocated $45 million more for restoration projects this year than in 2013.
But, really, you probably did not know any of that.
And as anglers, we all probably really should know where our tax dollars go — especially those funds that we pay extra for fishing tackle that go toward supporting our respective state’s fisheries.
The Theodore Roosevelt Conservation Partnership (TRCP) in Washington keeps tabs on those dollars on behalf of sportsmen and makes them easy for the average person to figure out.
“One of the priorities of the TRCP is to watch over budget actions that affect our nation’s water,” said Gene Gilliland, B.A.S.S. conservation director. “Now, the TRCP has created the Sportsmen’s Water Budget tracking tool that catalogs every federal water conservation program important to America’s hunters and anglers.”
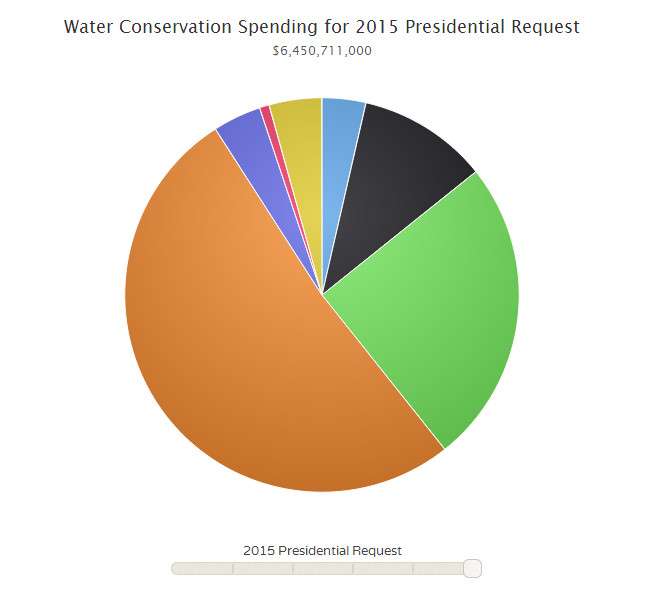
The database — with information displayed in a pie chart format — captures what the federal government is doing to improve aquatic habitat and enables you to compare it with past years.
“A really cool feature of the tool allows you to click on a slice of the pie chart to see what each agency budget looked like for the past three fiscal years and what the administration request is for the next fiscal year,” said Gilliland. “Click again on the individual programs to see a detailed description of what that program does with your tax dollars.
“It is becoming more and more important for anglers to know what is going on in the political arena. Educated anglers are educated voters — and that’s where you can make a difference.”
To see all the data in a spreadsheet format instead of a pie chart, click on the Download link at the bottom right of the pie chart, which you can find here.